Ray The Random Robot Commits Suicide
It has recently been pointed out to me by a sharp eyed reader of the Trading Gurus home page that Ray the Random Robot has been flatlining for quite a while now. Here's how his equity curve looks at this precise moment in time, courtesy of myfxbook:

Ray the Random Robot wipes himself out
Regular readers will remember that Ray suffered a near death experience in the Autumn of 2011. On that occasion he somehow survived by the skin of his shiny metal teeth, and lived to trade another day. A year later he finally did the job properly and killed himself off in true kamikaze style, as you can see in all too graphic detail above!
Now here's something to ponder. Ray is a robot of very little brain. As his freely available source code reveals he took essentially random entries. Despite that he somehow managed to survive for two years taking 6325 trades and making somewhere between 4% and 5% per month as a consequence. That is rather longer than some commercial "robots" one might mention. Buru Trader for example.
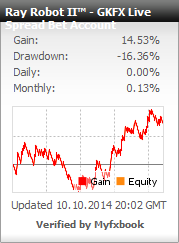
Fortunately long before his sad but predictable demise Ray fathered a son. Perhaps prophetically Ray Robot II was born over Halloween 2011, and his spread betting equity curve has now replaced his father's to the left of this article. Note that he also managed to maintain an average of around 4% per month for a while, but then "the markets changed"!
Whatever else you may do, please learn from Ray's heroic sacrifice, as his only son has done. Don't do stupid stuff (DDSS for short). Don't use Martingale money management (MMM for short) or any of it's close cousins in your auto-trading endeavours. If you see a "robot" with an equity curve that looks like Ray senior's (before his first big "blip" that is) run away as fast as you can. It will destroy your account, sooner or later.
Filed under Trading Systems by ![]()
Leave a Comment
Comments on Ray The Random Robot Commits Suicide
Jim, you have just put a huge argument into hands of antagonists of not only backtesting, but also paper trading and even systematic live trading. I can even hear hysterical voices: 'We have always said that backtesting was bs!', 'We have always said paper trading was bs!', 'We have always said trading robots were bs!' and so on. And you won't be able to explain them anything.
Hi Dr. L,
Can we perhaps agree on "over optimisation is BS"? "Doing stupid stuff" is, well, stupid? "Backtesting with a bit of common sense" is brilliant?
Also how about "There are none so blind as those who will not see"?
Please bear in mind that Ray has been cunningly constructed to be as artificially stupid as modern automated forex trading technology allows. Perhaps removing all the stupid stuff from between Ray's ears would be a brilliant idea? What would all the naysayers say then?
Jim
This article was forwarded to me by someone who had doubts about using martingale as part of risk/money management. It appears that the user of this system did not place any proper limitations to contain the drawdown, let alone have any systematic approach to entries AND exits. It appears to be an "all or nothing" deal, holding you breath that the 'nothing' does not come. Of course eventually the 'nothing' wipeout came. No surprises here for the initiated.
This is actually a very good example of how so many people misuse something they do not fully understand. Then instead of doing honest investigation to improve the design, they write it off as "it doesn't work"
And of course, the author does not provide an alternative money management that would have prevented this. From my experience of using single lot size grids vs 2x and 3x martingale, I would say that the user of this strategy needs to consider net profits vs net losses and at the minimum cut his losses shorter. that would require that the entry detection also be consistent. Trading any type of grid strategy (or any strategy for that matter) without a complete system of limitations that can account for all possible outcomes (profit or loss) is a disaster waiting to happen. But at least it's not a blackbox, so there is hope that some investigation and tweaking can curb the drawdown and keep the gains.
Hi Jon,
It seems you misunderstand Ray's purpose in "life". He was designed for "educational" purposes, not "financial" ones. He was indeed "a disaster waiting to happen". However that disaster took a long time to arrive. If you were to cherry pick certain sections of Ray's equity curve they might very well impress "the uninitiated"?
The source code for some alternative methods of money management are available for download from the Trading Gurus Community Forum, together with a variety of alternative entry and exit strategies. Do you by any chance have some example source code you could provide us with to demonstrate the efficacy of a "grid strategy with a complete system of limitations that can account for all possible outcomes"? We don't have one of those to experiment with as yet!
I do not have code, but I do have a plain english summary for CleverTrader grid system, which uses a mechanical definition of a tradecycle:
1) Detect initial entry condition based on APAMI trend measurements
2) Actual entry[ies] in a counter-trend grid formation.
3) Exits based on net profit, breakeven, smaller loss, or stop loss target.
4) Repeat steps 1, 2, 3.
A more complete explanation of tradecycles is here: http://www.traderslaboratory.com/forums/forex-trading-laboratory/13909-implementing-successful-systems-part-1-anatomy.html . While that is enough to begin the process of full system development (handles all possible risk outcomes market-wise), a more complete rules for a full mechanical system that I trade with (and can be traded manually) is forthcoming.
I now understand this 'ray' was more of an educational demonstration; perhaps you can explain what the lesson[s] you were trying to convey was. I gather it was to show that a [blackbox] system can appear to 'work' for a period of time and then eventually fail? You did not mention what the endgame was. Do you have a page that actually explains in plain english how ray works? Or does the source code have the explanation? Some sort of instruction manual or summary on how the major components work together (the rules and intentions). The source code can then be used to verify the author's original intent (plain language explanation of strategy). I do not have a membership to the forum, but will attempt to retrieve the source code somehow. The mod rules are somewhat strange considering you insist people visit the forum for details, but then they are unable to do anything in regards to download; even after they sign up.
Also, there is no subscription here so I do not know if someone replies.
Hi Jon,
Your "plain English summary" is far too vague to code. In my experience simple "counter-trend grid" strategies have equity curves that look a lot like Ray's. I assume your grid isn't infinite?
There's plenty you can read about Ray over on the forum, where you should now "have a membership". Perhaps you would care to comment on the intentionally awkward entry procedures? Ray's "plain English summary" goes as follows:
There is a slight modification to the sizing in the multi-instrument version of Ray, since that was designed to try and survive to the end of a "robot trading competition". When he's almost run out of margin he increases his stop/limit rather than his size.
In addition to your own suggestion Ray also demonstrates what the equity curve of a common or garden Martingale-like trading strategy looks like. Beyond that I also mentioned many moons ago that:
You should be able to subscribe to email alerts about new comments on here now. Please let me know if that facility still isn't working properly.